It is interesting to note that ICMP is a network layer protocol and mainly used by network devices to talk to each other
Traceroute
❯ traceroute -I www.google.comtraceroute to www.google.com (142.251.223.4), 30 hops max, 60 byte packets 1 10.145.0.3 2.861 ms 2.848 ms 2.840 ms 2 10.120.0.25 2.833 ms 3.870 ms 3.864 ms 3 10.250.1.9 3.856 ms 3.851 ms 3.845 ms 4 * * * 5 * * * 6 * * * 7 * * * 8 * * * 9 * 142.250.172.80 121.647 ms 121.600 ms10 142.251.76.31 119.703 ms 121.583 ms 121.669 ms11 192.178.110.244 121.572 ms 121.567 ms 119.482 ms12 142.250.213.171 119.441 ms 119.434 ms 117.319 ms13 216.239.49.130 117.327 ms 117.320 ms 117.314 ms14 142.250.62.67 117.307 ms 115.186 ms 104.474 ms15 * * *16 * * *17 * * *18 * * *19 * * *20 lcmaaa-ao-in-f4.1e100.net 101.133 ms 103.220 ms 101.638 ms
Geographical Locations
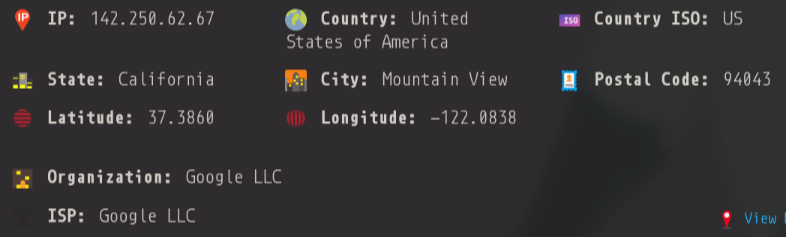
The IPs from 9 to 14 all belong to Mountain View, California
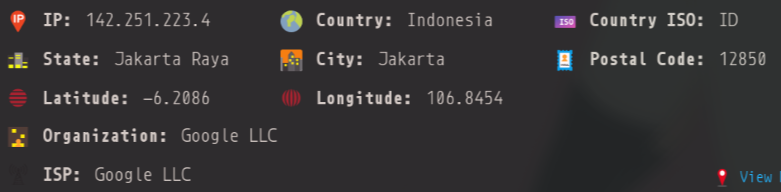
The final IP is from Jakarta, Indonesia
MyTraceroute
mtr1 is a similar service that combines the functionality of traceroute and ping into a single netwrok diagnostic tool
it prints running statistics about each intermediate router
only just slightly different from the traceroute output :)
Control Plane Policing and Asymmetric Routing
in the traceroute and the mtr you may have noticed that the time for the final hop is significantly less than the time for some of the intermediate hops
11 192.178.110.244 121.572 ms 121.567 ms 119.482 ms12 142.250.213.171 119.441 ms 119.434 ms 117.319 ms
where latency is 120ms
20 lcmaaa-ao-in-f4.1e100.net 101.133 ms 103.220 ms 101.638 ms
and here the latency is 101ms
The reason is that routers have a Control Plane1 that handles when it needs to send an icmp response back to the source. Network Operators set arbitrary rate limits on the Control Plane, that delay when a process is finally processed by the router and sent back. Whereas the final node is probably going to be configured to send a response back as soon as possible
There is also the issue of asymmetric routing2 where the path back from the remote machine to you may not be the same. This backward path may take longer than the forward path, introducing more delays (its usually just because of control plane policing though)
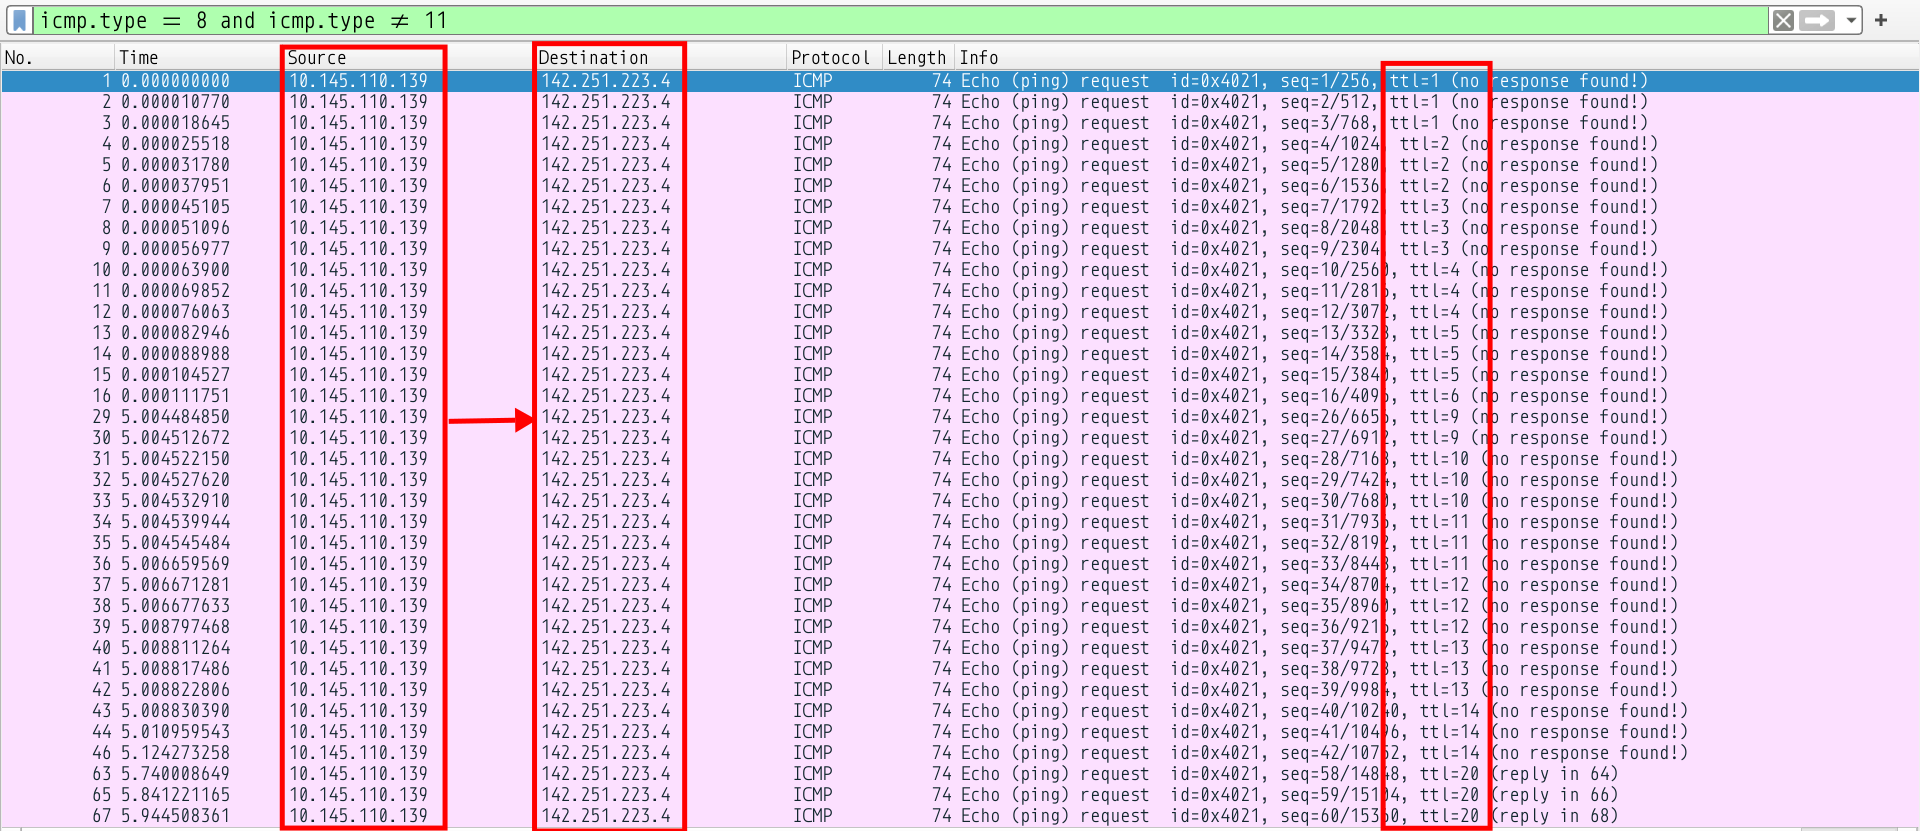
Time to Live
Time to live in seconds; as this field is decremented at each
machine in which the datagram is processed, the value in this
field should be at least as great as the number of gateways which
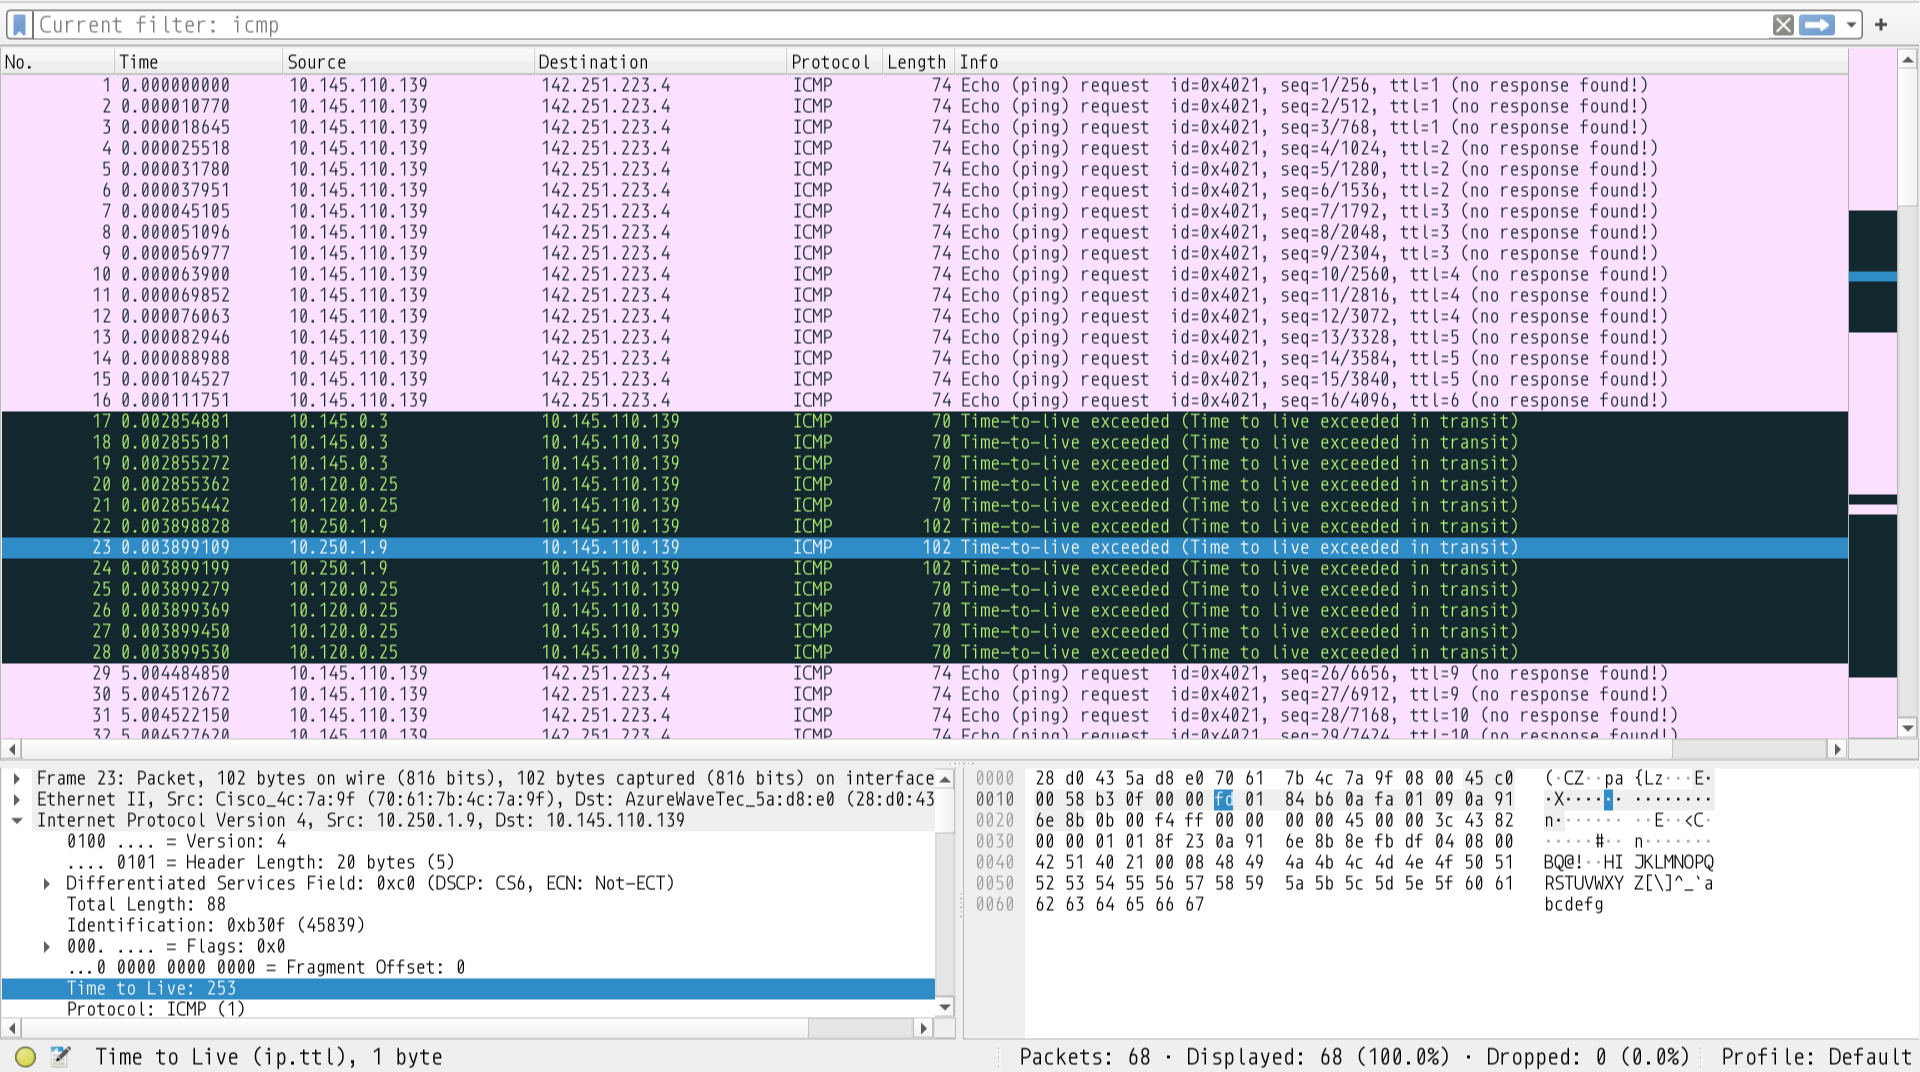
this datagram will traverse.
So the TTL is essentially set to the number of machines the packet will be routed through before hopefully being sent back to the source (me).
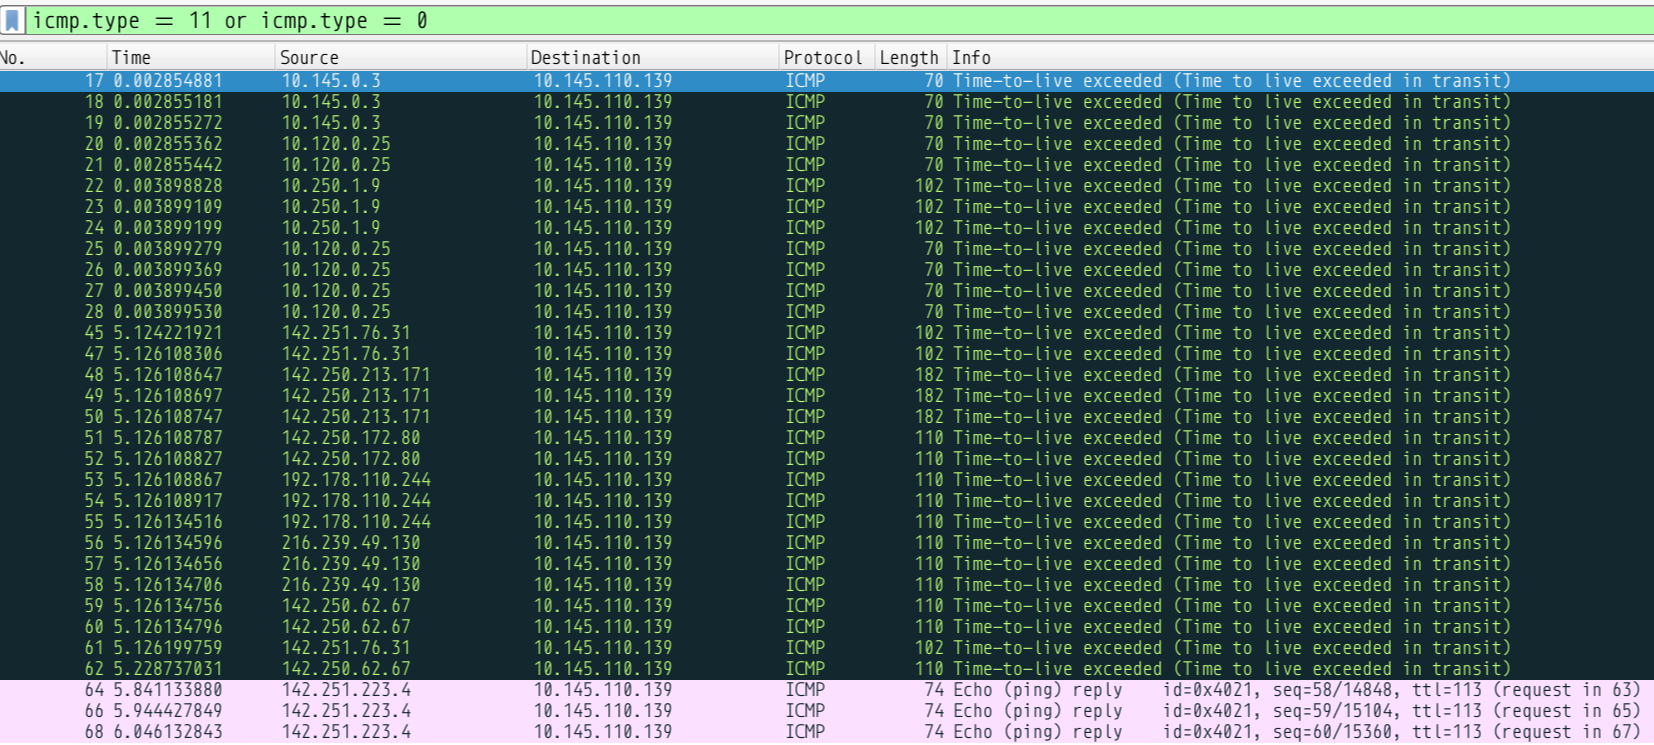
This helps us understand how traceroute and similar tools work. They send the destination many icmp echo requests with varying TTLs, and as these TTLs are decremented, they will all hit 0 at different routers, which will say TTL expired and send an ICMP packet back to the source (me)
Regarding fields that change, the Identification(ip header), TTLs, Sequence Numbers, and Checksums change between datagrams, and the others remain constant
The Identification field of the IP Header increases starting at some base value and increases by one with each packet sent.
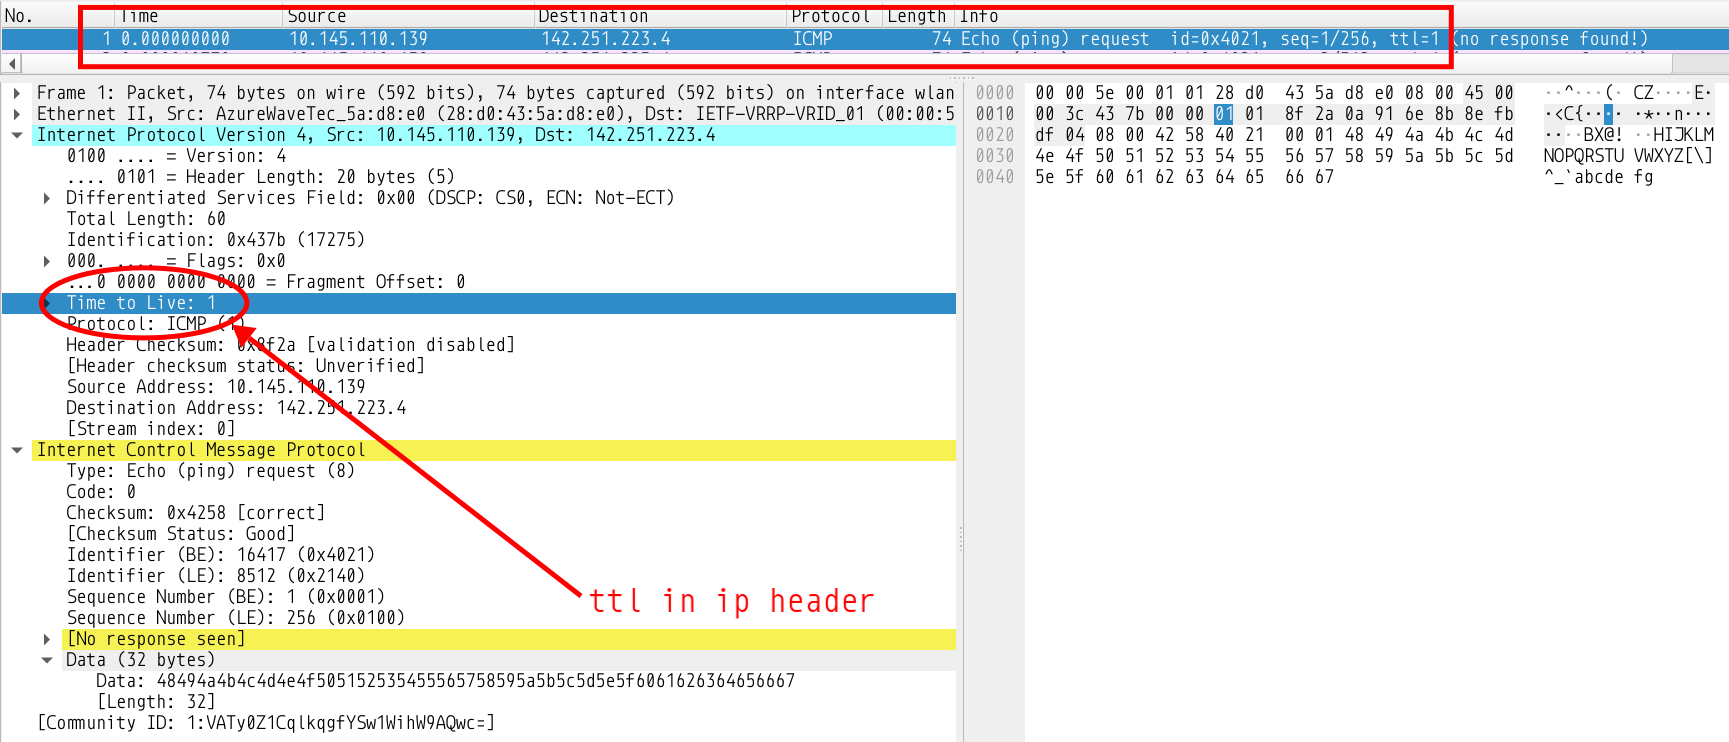
The Identification for my first request packet is 0x437b
The Identifier field of the ICMP Packet is some constant value for Echo Requests. The value is 0x4021 in my case (visible in the image)
The Sequence Number field starts at 1 and increases by 1 for each request
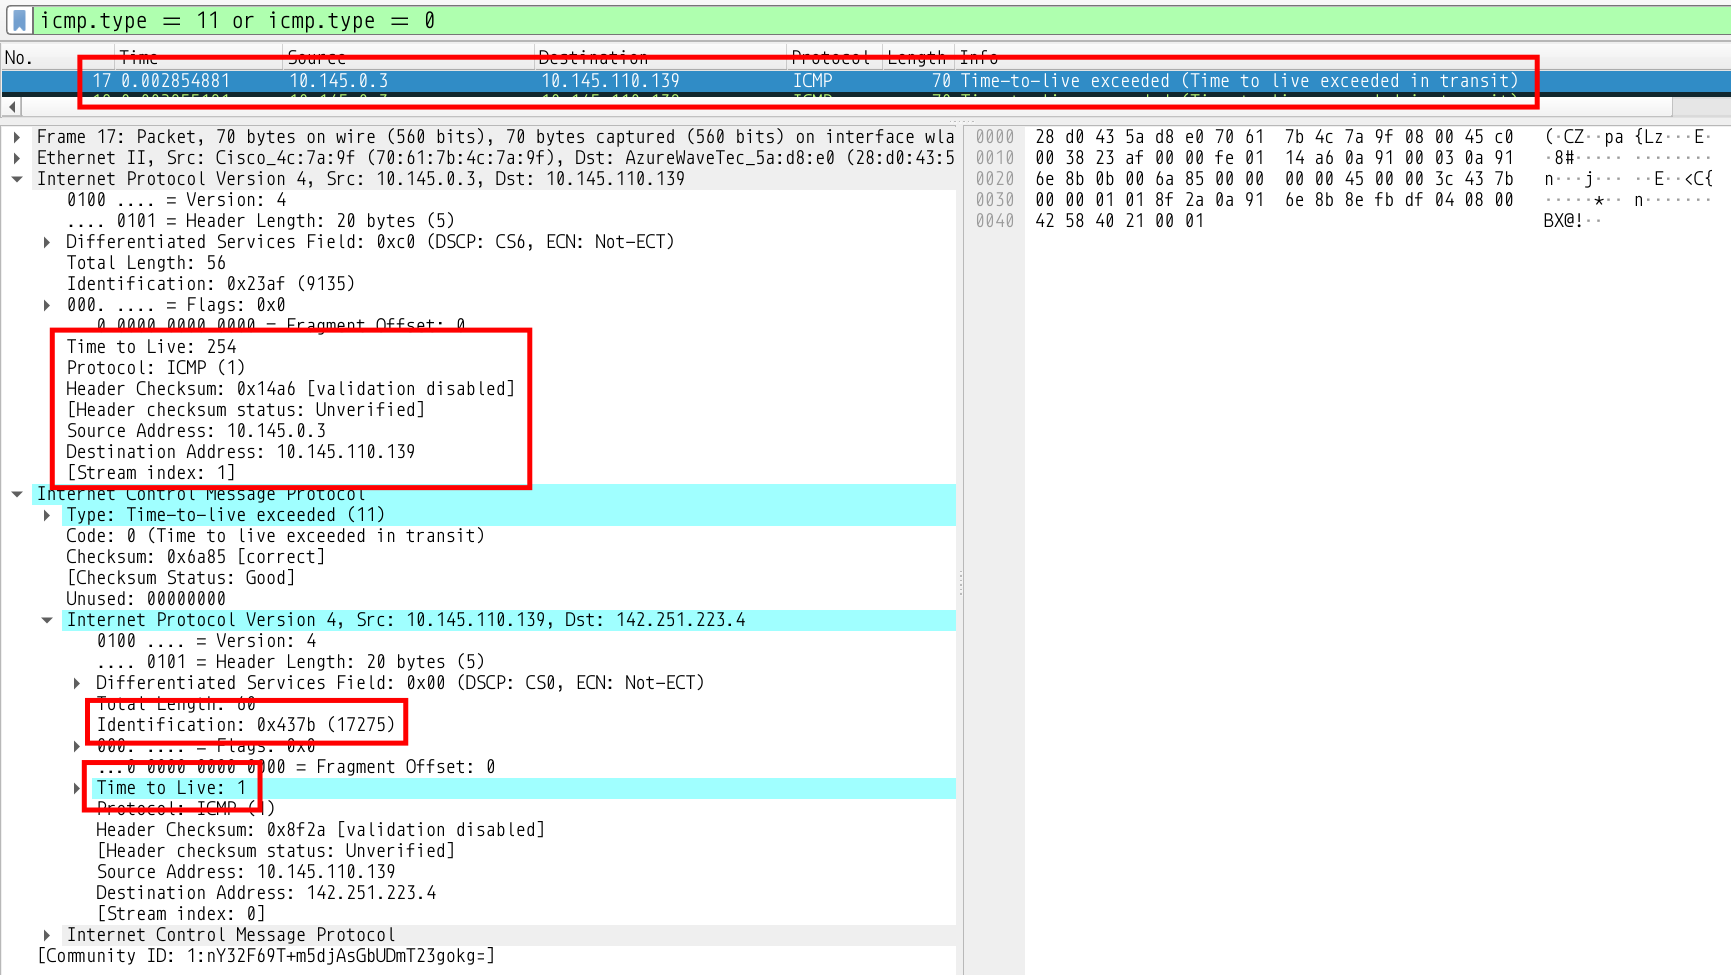
The First ICMP Echo Reply
We see the first reply is from 10.145.0.3 which corresponds to our first entry in the traceroute
1 10.145.0.3 2.861 ms 2.848 ms 2.840 ms
You can see the IP Header of the request packet attached and its Identification field contains the value of the identifier of the ping whose TTL expired, which is the first packet, the one with the identification 0x437b mentioned above. The TTL field is set to 254. It was probably set to 255 (max possible) and decremented by one when the source (me) received it
You can see the series of ICMP TTL exceeded replies sent by all the intermediate gateways that helped form our traceroute
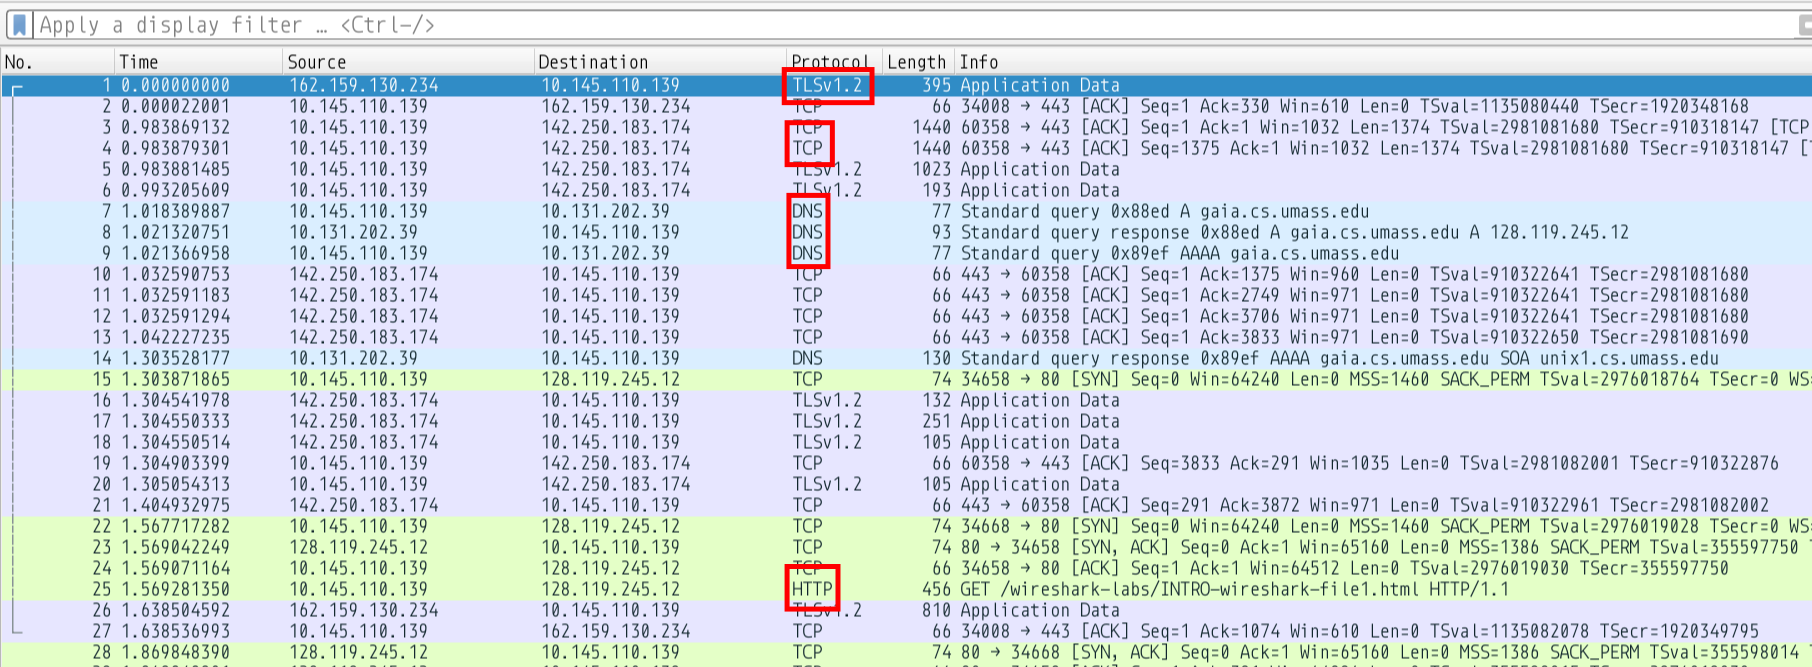
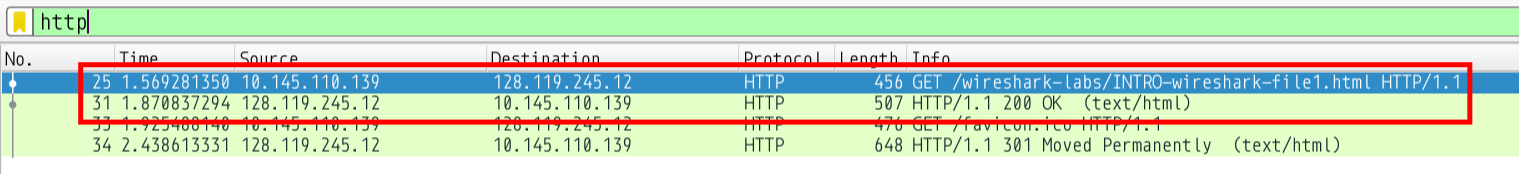
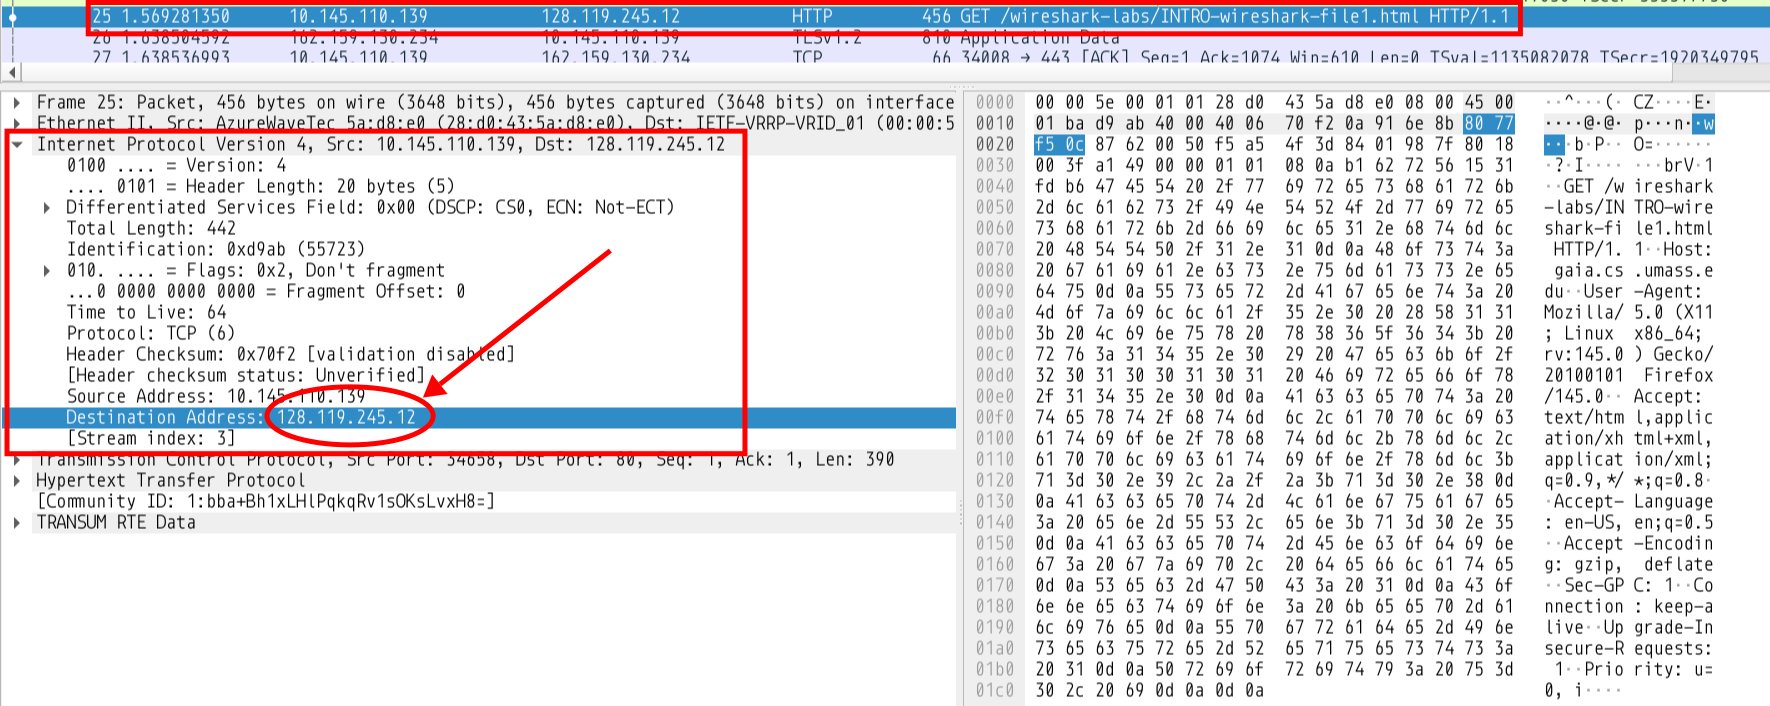
Being a(the) network layer protocol its responsible for routing packets from the source address to the destination address. So looking at the IP Header of the HTTP GET request
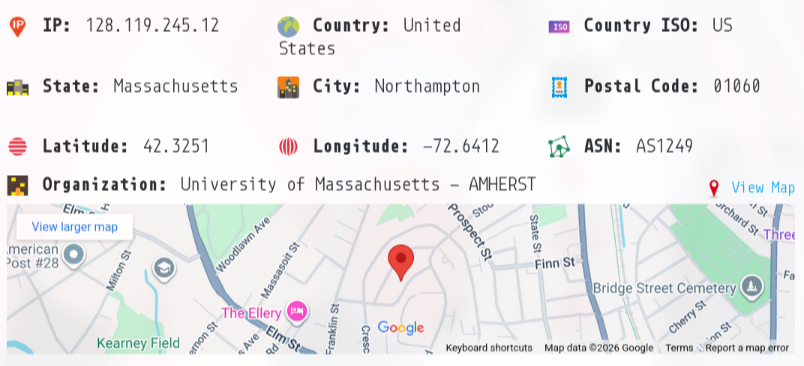
By doing a DNS lookup we can try to identify the physical address of this IP
which as we can see maps to the University of Massachusetts
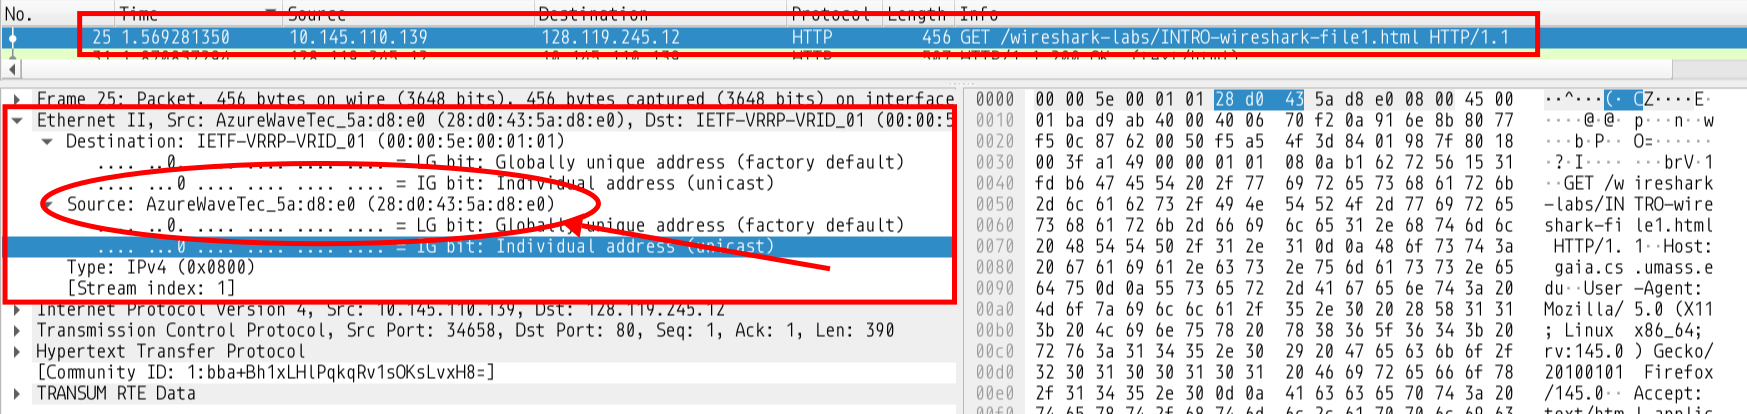
MAC Address
Medium Access Control address is also called the Ethernet address and is a unique ID given to every network hardware component. To find the MAC addresses in this HTTP packet we simply need to move a layer above the IP header and look at the Ethernet Header5
Ethernet transmission layer (not necessarily accessible to the user):
    48.bit: Ethernet address of destination
    48.bit: Ethernet address of sender
    16.bit: Protocol type = ether_type$ADDRESS_RESOLUTION
Ethernet packet data:
    16.bit: (ar$hrd) Hardware address space (e.g., Ethernet, Packet Radio Net.)
    16.bit: (ar$pro) Protocol address space.  For Ethernet hardware, this is from the set of type fields ether_typ$<protocol>.
      8.bit: (ar$hln) byte length of each hardware address
      8.bit: (ar$pln) byte length of each protocol address
    16.bit: (ar$op)  opcode (ares_op$REQUEST | ares_op$REPLY)
    nbytes: (ar$sha) Hardware address of sender of this packet, n from the ar$hln field.
    mbytes: (ar$spa) Protocol address of sender of this packet, m from the ar$pln field.
    nbytes: (ar$tha) Hardware address of target of this packet (if known).
    mbytes: (ar$tpa) Protocol address of target.
As we can see the MAC address of the source(me) is 28:d0:43:5a:d8:e0
TCP assigns a sequence number to every byte of data transferred
The sequence number field tracks the sequence number of the byets transferred so far
if a host has sent 1400 bytes so far, and is going to send a packet of size 200, the sequence number of the packet will be 1400 and after the packet is sent the sequence nunmber will be incremented to 1600
Acknowledgement Number:
this number is a counter to keep track of every byte received
if 1000 bytes are received, it increases the acknowledgement number by 1000 when it sends out a packet in response
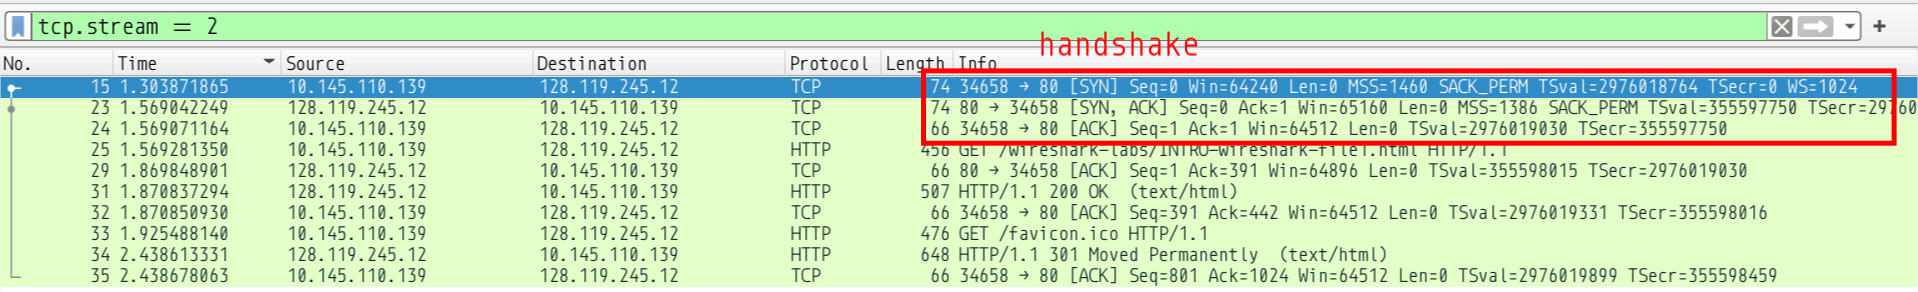
TCP is a connection-oriented protocol, it must establish a connection between two applications before sending packets. And HTTP is build on TCP so there must be packets establishing a connection with the website in the pcap. Wireshark very neatly separates these different TCP connections as streams for us
Lets look at the seq numbers and ack numbers (i am using the relative numbers provided by wireshark)
    SOURCE(ME)                                HOST(gaia.cs.umass.edu)

1.  SYN-SENT    --> <SEQ=000><ACK=000><CTL=SYN>      --> SYN-RECEIVED
2.  ESTABLISHED <-- <SEQ=000><ACK=001><CTL=SYN,ACK>  <-- SYN-RECEIVED
3.  ESTABLISHED --> <SEQ=001><ACK=001><CTL=ACK>      --> ESTABLISHED
Ghost Bytes
It may be interesting to note that since the payload size of these packets is zero, there is no actual byte being consumed. Instead the protocol specifies that since the SYN flag is set the ACK will send client seq + 1. This is our “ghost byte”.
So if we received a pure ACK without the SYN flag (like the 3rd packet of the handshake) it doesn’t increase either the seq_num or ack_num since there’s no actual data
We can also look at the GET request and the acknowledgement sent by the server. Note the GET had a TCP payload of 390 bytes
The server has successfully acknowledged the 390 bytes we sent it
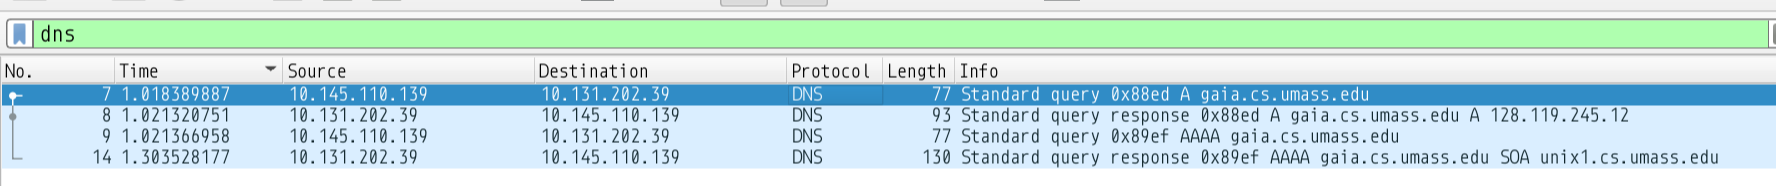
DNS Queries
Every DNS packet has the below basic format. An RR is a Resource Record7
+---------------------+
|        Header       |
+---------------------+
|       Question      | the question for the name server
+---------------------+
|        Answer       | RRs answering the question
+---------------------+
|      Authority      | RRs pointing toward an authority
+---------------------+
|      Additional     | RRs holding additional information
+---------------------+
The queries went to the first DNS recursor where it found an entry because it must have been cached and the recursor returned two records
A record: standard ipv4 address record
AAAA record: returns ipv6 record
I don’t see any CNAME records for this address
The response times were 2ms for the A record and 282ms for the AAAA record
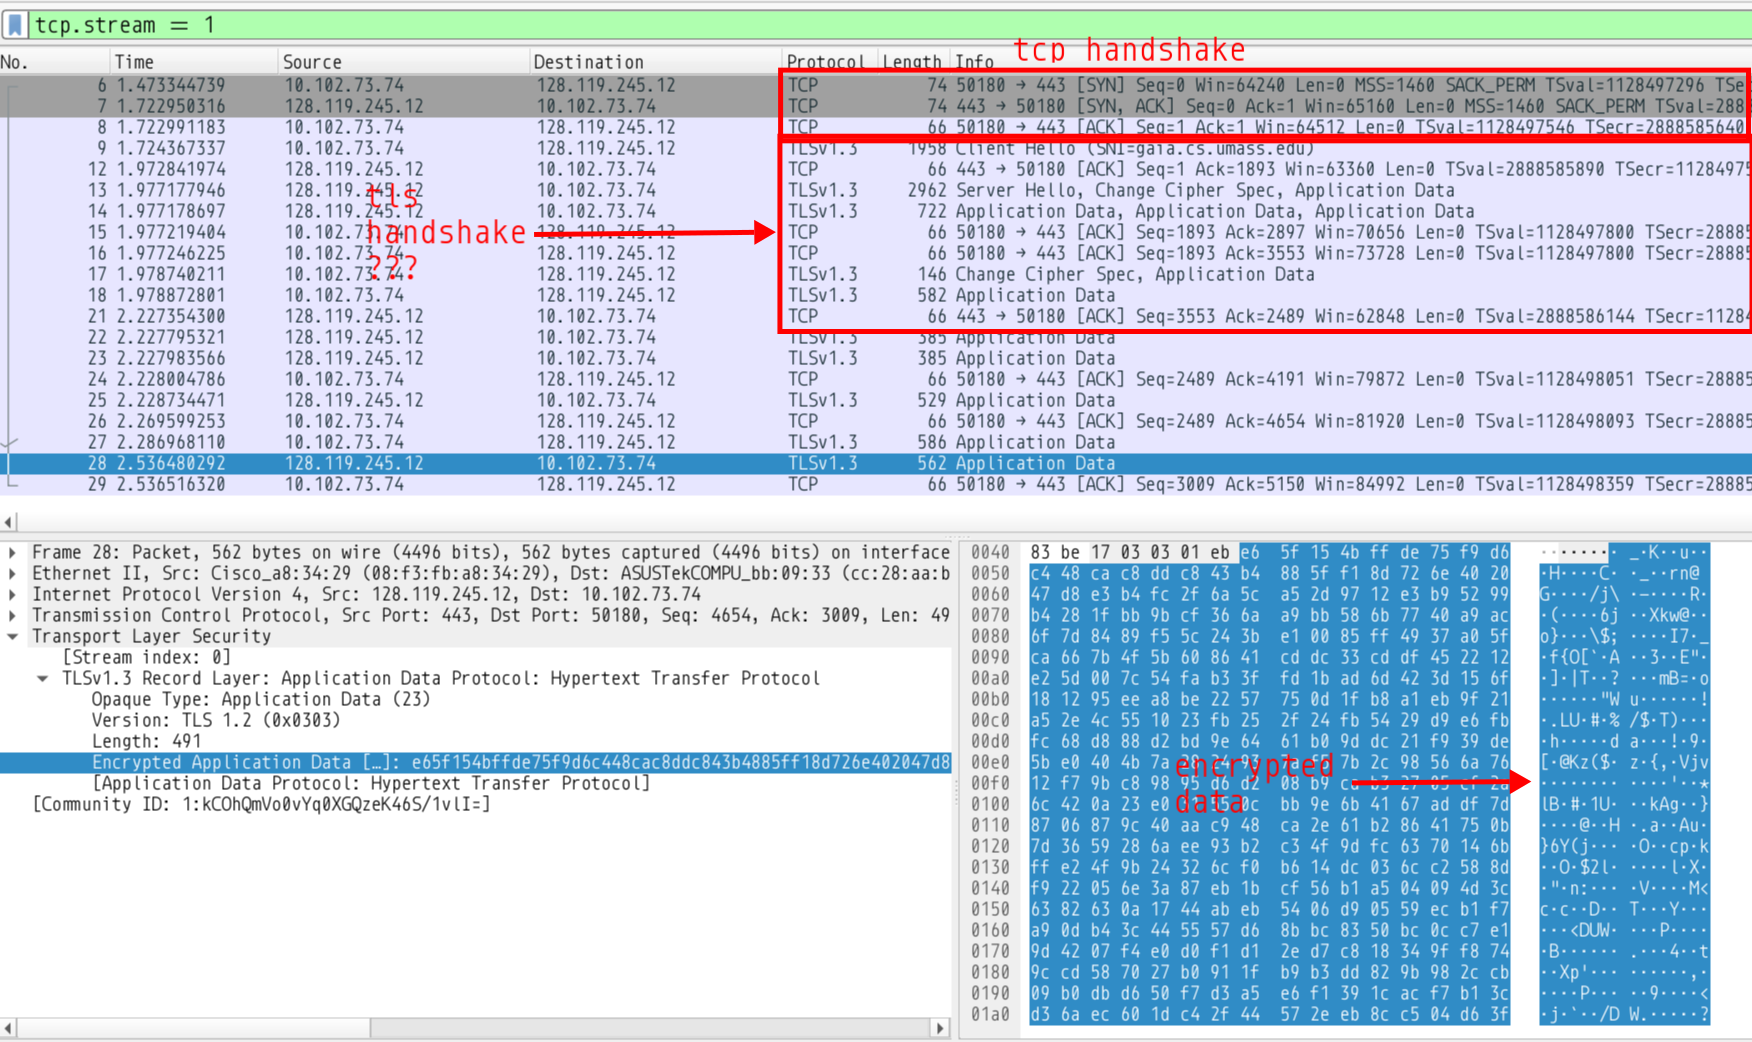
Browsers these days usually upgrade the HTTP connection to an HTTPS one. HTTPS includes a seecurity layer that encrypts HTTP traffic.
I don’t know the internals of TLSv1.3 enough to properly recognise where the handshake ends, but as we can see key exchanges and random secrets and certificates are being exchanged in there somewhere
This results in our final payloads being encrypted and unreadable to an interfering body (also me). You may also note that HTTPS traffic goes to port 443 on the server instead of port 80 like in HTTP