Observability and Measurement
2026-11-18
notes / DOCS
- Behave in desirable manner across
- all intended circumstances
- all usage patterns
- Service Level Agreements (SLA) - defines the expected quality, availability, and responsibilities of the service
Interesting Case Studies
1. ERP Overload Under High Load Conditions
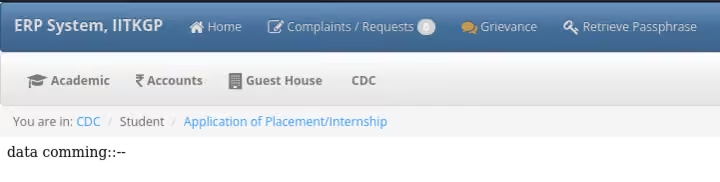
What could the issue have been causing subject registration to be delayed by a few hours:
- Network?
- Early investigation ruled out the possibility of network being the bottleneck (~8% utilization).
- CPU?
- also sufficiently within limits
- Database?
Actual issue was database contentions - multiple transactions need to wait for each other to complete. This caused the ingress queue to fill up, and all subsequent requests were being dropped.
Resolved by splitting up the huge main table into several specialized smaller tables - "sharding" (somewhat)
The problem was discovered by eliminating potential issues by looking at utilisation metrics of the system
2. Google DDoS 2023
- Recorded ~400M rps at peak (about 10 times larger than the previous record)
- Google managed to tank it seamlessly
How much compute does Google really need???
If Google can accomodate 400M rps spikes, does that mean in regular cases its always under-utilized?
Trying to answer this in class:
- Having dedicated servers for "DDOS-detection" does not help, it just moves the problem to a different layer
- Can we repurpose other machines to act as these detection servers on demand instead?
- There's two obvious costs:
- Engineering a fabric that supports this
- Degradation in other services that these shape-shifted machines were originally responsible for
- [Imad] personally [has] two issues with this:
- If we want to minimize the degradation, we should only try to get the unutilized resources (compute/bandwidth/etc) from the repurposed machines, but that implies we're already running in under-utilized conditions
- If by repurposing we're taking away actually utilized resources from other services, it's no longer "seamless", and the DDOS did it's job in some capacity
- This becomes an interesting trade-off question on how much "degradation" we're willing to allow, if it means we can ensure that stable-state utilization stays within reasonable bounds.
Google actually has a couple of blogs about this attack
- The HTTP/2 "Rapid Reset" Attack
- How they mitigated it
HTTP/2 allows stream multiplexing (to some maximum limit) over a single TCP connection to enable parallely servicing resource requests. With this they also provide a RST_STREAM method that invalidates the current stream. The "Rapid" part comes from being able to RST a stream in the same request as creating it.
This is essentially an arbitrage opportunity to grab the server's bandwidth. You can create and invalidate as many streams as you like while still having valid streams under the maximum limit.
Google calls this is a Layer 7 Attack (physical layer) because all the effort is spent in parsing and processing the stream headers only for them to terminated moments later, wasting tons of compute.
In Google's words: "Mitigations for this attack vector can take multiple forms, but mostly center around tracking connection statistics and using various signals and business logic to determine how useful each connection is."
Google doesn't just have a shit ton of random compute laying around to one day mitigate 400M requests (i hope). They have a very smart observability layer and ruleset, paired with their massive distributed network of servers. Edge servers have many layers of rules that decide whether packets are valid or not, from programmable hardware to kernel hooks throughout the network stack.
So when they identified the "Rapid Reset" issue they could quickly say, if we have this many RSTs in such a short period of time, that's not normal. Let's just close that connection. And funnily enough that HTTP/2 method is named GOAWAY
some sort of data collection and observation per connection is required, this goes beyond just your anonymous resource utilisation but requires tagging each operation with an identity
3. Amazon AWS S3
Amazon guarantees 99.999999999% durability (11 nines) for your uploaded objects
- Trillions of objects with millions of transactions per second
- Repetition can improve data integrity across corruptions; Amazon provides availability zones for this
"An Availability Zone is one or more discrete data centers with redundant power, networking, and connectivity in an AWS Region. Availability Zones are physically separated by a meaningful distance, many kilometers, from any other Availability Zone, although all are within 100 km (60 miles) of each other. These services are designed to handle concurrent device failures by quickly detecting and repairing any lost redundancy, and they also regularly verify the integrity of your data using checksums."
4. Netflix Simian Army
- Simulate, doctor and prepare for outages in different portions of the stack
- Netflix blog about their monkeys
Exposing engineers to failures more frequently incentivizes them to build resilient services.
All to improve the fault tolerance of your systems. More at https://principlesofchaos.org/
5. Sleeping vs Busy Wait
- In cases where the context-switch required for sleeping is costlier than the cycle-wastage in a spin-lock, we prefer busy waiting
- Actually used in a lot of places within the kernel
From the kernel docs:
Use mutex when:
  ✓ Critical section may block (e.g., kmalloc(GFP_KERNEL), copy_from_user)
  ✓ Critical section is long (milliseconds)
  ✓ You're in process context

Use spinlock when:
  ✓ Critical section never blocks
  ✓ Critical section is very short (microseconds)
  ✓ You're in interrupt context
  ✓ You need IRQ protection (spin_lock_irqsave)
- kernel mutexes
- kernel spinlocks
- more kernel locktypes
Terminology
Utilization & Saturation
- Time-based
- Capacity-based (better because we have a baseline)
- Dilemma - both <100% and 100% utilization are not entirely desirable.
- It boils down to how we handle the "Saturation" condition
- The numbers itself are easy to get - hardware registers. Even if they're naive measures on their own, they're free
- Having proper context helps in better profiling
Why cpu utilization is wrong (this brendan gregg person seems important)
Queueing Theory
Model everything around a queue
Input => (queue) => Service => Output
Leads to a lot of complex mathematical modelling that doesn't scale
Process state diagram comes from a queue model
We usually model the arrival of inputs as a poisson distribution
This gives us a mathematical model, with (typically loose) upper bounds
Instrumentation
- Like logging -> add code to get valuable information
Static Instrumentation
- Hard-coded
- Eg: linux kernel
dmesg
- USDT: user statically defined tracing
Dynamic Instrumentation
- During runtime
- Debuggers - we need to be able to (from a separate process):
- Stop/resume program
- Step instructions
- View memory
Measurement
Obvservability
- Passive measurement (active = benchmark, requires experimentation)
- Counters, profiling, tracing
Counters
perf
❯ sudo perf stat -dd -a -- sleep 10

 Performance counter stats for 'system wide':

           133,440      context-switches                 #    833.8 cs/sec  cs_per_second
        160,043.27 msec cpu-clock                        #     16.0 CPUs  CPUs_utilized
             3,207      cpu-migrations                   #     20.0 migrations/sec  migrations_per_second
            70,400      page-faults                      #    439.9 faults/sec  page_faults_per_second
       342,515,301      L1-dcache-load-misses            #      5.7 %  l1d_miss_rate            (20.00%)
        19,017,501      L1-icache-load-misses            #      0.7 %  l1i_miss_rate            (20.02%)
       173,105,633      branch-misses                    #      5.5 %  branch_miss_rate         (20.01%)
     3,166,099,517      branches                         #     19.8 M/sec  branch_frequency     (30.01%)
    20,749,773,370      cpu-cycles                       #      0.1 GHz  cycles_frequency       (29.99%)
    15,818,680,545      instructions                     #      0.8 instructions  insn_per_cycle  (30.00%)
     5,673,891,117      stalled-cycles-frontend          #     0.27 frontend_cycles_idle        (30.00%)
        63,843,649      dTLB-loads                       #     20.1 %  dtlb_miss_rate           (29.99%)
         7,832,706      iTLB-loads                       #     81.5 %  itlb_miss_rate           (29.99%)

      10.002952510 seconds time elapsed
you can get a lot more stuff with vmstat, iostat, etc
❯ iostat
Linux 7.1.4-artix1-1    08/02/2026  _x86_64_    (16 CPU)

avg-cpu:  %user   %nice %system %iowait  %steal   %idle
           2.51    0.01    1.43    0.03    0.00   96.03

Device             tps    kB_read/s    kB_wrtn/s    kB_dscd/s    kB_read    kB_wrtn    kB_dscd
nvme0n1           0.00         0.07         0.00         0.00       9280          0          0 # windows drive
nvme1n1          10.51       102.82       318.87         0.00   13400748   41559482          0 # linux drive
Profiling
Sampling at some frequency for some short duration. For example lets look at where my project spends most of its time
❯ timeout --signal=INT 10s perf record -- ./build/ppGB-emu ./roms/tetris.gb
[ perf record: Woken up 5 times to write data ]
[ perf record: Captured and wrote 1.540 MB perf.data (40139 samples) ]

❯ perf report
Overhead  Command          Shared Object                 Symbol
   5.84%  ppGB-emu         libc.so.6                     [.] pthread_rwlock_unlock
   5.01%  ppGB-emu         libSDL3.so.0.4.12             [.] 0x0000000000017671
   4.82%  ppGB-emu         libSDL3.so.0.4.12             [.] 0x000000000001766b
   4.81%  ppGB-emu         libSDL3.so.0.4.12             [.] 0x0000000000017669
   4.78%  ppGB-emu         libc.so.6                     [.] pthread_rwlock_rdlock
   4.35%  ppGB-emu         ppGB-emu                      [.] std::vector<unsigned char, std::allocator<unsigned char> >::size() const
   3.29%  ppGB-emu         libc.so.6                     [.] pthread_mutex_lock
   2.22%  ppGB-emu         ppGB-emu                      [.] CPU::cpu_step()
   2.03%  ppGB-emu         ppGB-emu                      [.] STAT_REG::getBit(int) const
   1.93%  ppGB-emu         libSDL3.so.0.4.12             [.] 0x0000000000016627
   1.82%  ppGB-emu         ppGB-emu                      [.] PPU::SetPixel(unsigned int)
   1.66%  ppGB-emu         libc.so.6                     [.] 0x0000000000175141
   1.59%  ppGB-emu         ppGB-emu                      [.] std::vector<unsigned char, std::allocator<unsigned char> >::operator[](unsigned long)
   1.55%  ppGB-emu         libc.so.6                     [.] 0x000000000017514b
   1.43%  ppGB-emu         ppGB-emu                      [.] LCDC_REG::getBit(int) const
   1.33%  ppGB-emu         libc.so.6                     [.] 0x000000000009c6ec
   1.31%  ppGB-emu         ppGB-emu                      [.] PPU::ppu_step()
   1.28%  ppGB-emu         ppGB-emu                      [.] PPU::GetSurface() const
   1.19%  ppGB-emu         libc.so.6                     [.] 0x00000000001758cd
   1.15%  ppGB-emu         libSDL3.so.0.4.12             [.] 0x0000000000016894
   1.09%  ppGB-emu         ppGB-emu                      [.] std::operator==(std::_Deque_iterator<Pixel, Pixel&, Pixel*> const&, std::_Deque_iterator<Pixel, Pixel&, Pixel*> const&)
   0.97%  ppGB-emu         libSDL3.so.0.4.12             [.] 0x00000000001690d7
   0.88%  ppGB-emu         libSDL3.so.0.4.12             [.] SDL_GetSurfaceProperties
   0.87%  ppGB-emu         ppGB-emu                      [.] STAT_REG::ResetLYEqualLYC()
   0.80%  ppGB-emu         ppGB-emu                      [.] IF_REG::resetBit(int)
   0.75%  ppGB-emu         libSDL3.so.0.4.12             [.] SDL_GetWindowSurface
   0.71%  ppGB-emu         libc.so.6                     [.] 0x0000000000175147
   0.66%  ppGB-emu         libSDL3.so.0.4.12             [.] 0x00000000000166f7
   0.66%  ppGB-emu         libSDL3.so.0.4.12             [.] 0x00000000000168e0
   0.63%  ppGB-emu         ppGB-emu                      [.] Gameboy::gb_step()
Looking at this the code spends about 4% of the time on vector.size(), since I don't really have any dynamic containers, I could probably save around 4% of the time by just hardcoding array sizes